Category: Accident Statistics
-

What is the Safest Way to Travel?
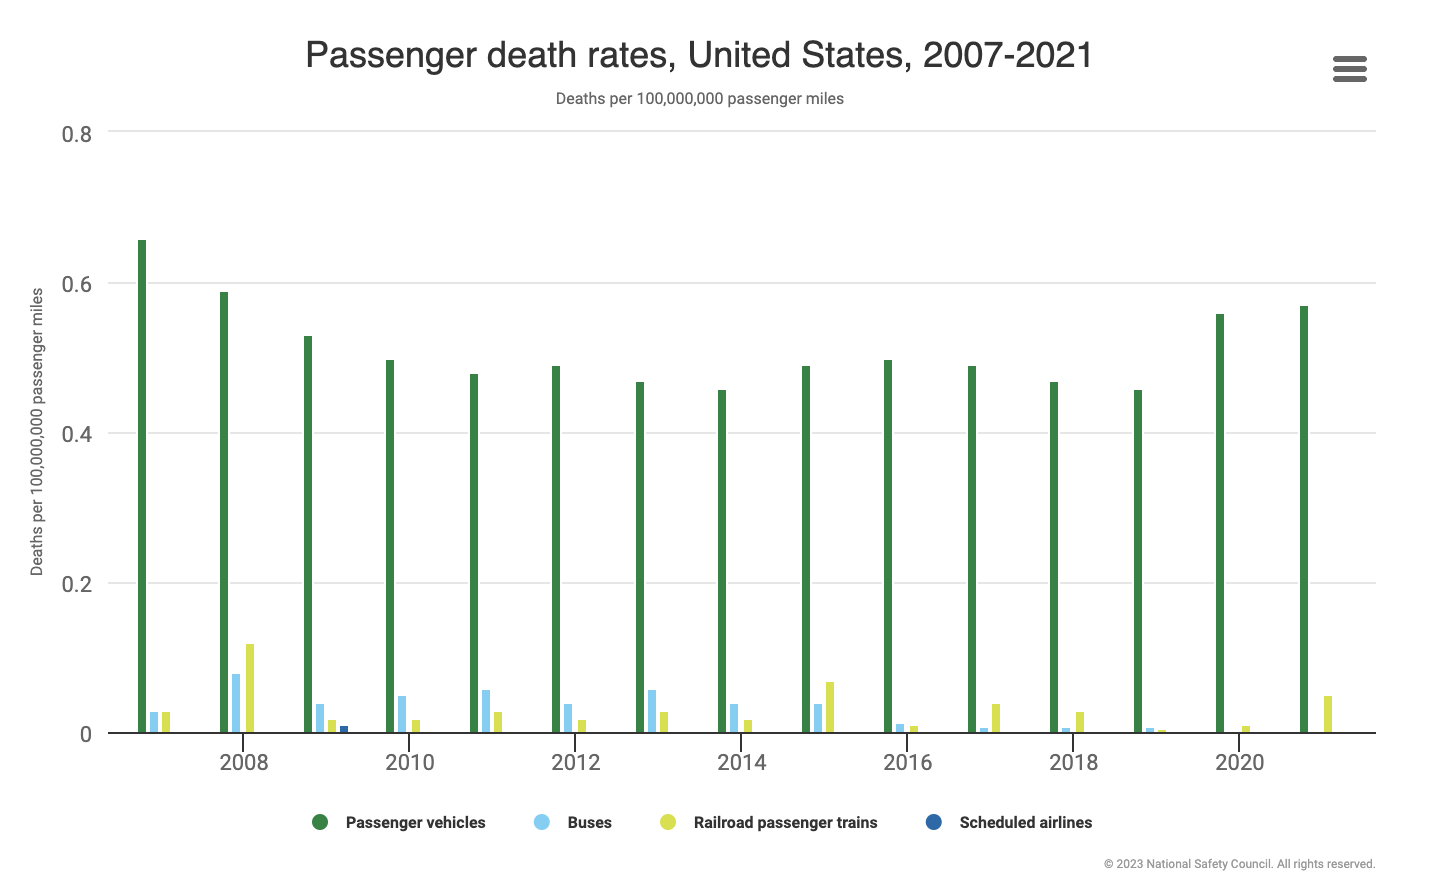
Information and Statistics on Major Forms of Transportation Are you wondering what the safest way to travel is? Some people who are afraid of flying on airplanes are especially interested in the answer to this question. What they, any many others, may not realize is that the way most people travel (by car) is in…
-

Statistics of Crashes by Roadway Type in the U.S.
The National Highway Traffic Safety Administration (NHTSA) uses data on the cost of roadway crashes to plan for highway safety and make decisions about where to allocate limited funds for roadway construction. They use data from several systems like FARS, GES, and NMVCCS to track and analyze the data. Roadway classifications To analyze this data,…
-
Cost of Car Accidents in Every State in the U.S.
According to the National Highway Safety Administration, the total economic costs due to motor vehicle crashes was $340 billion dollars. Below is a table with the cost (in millions) of motor vehicle accidents in every state in the U.S., and D.C. State Annual Cost % Total ALABAMA $6.437 billion 1.90% ALASKA $627 million 0.20% ARIZONA…
