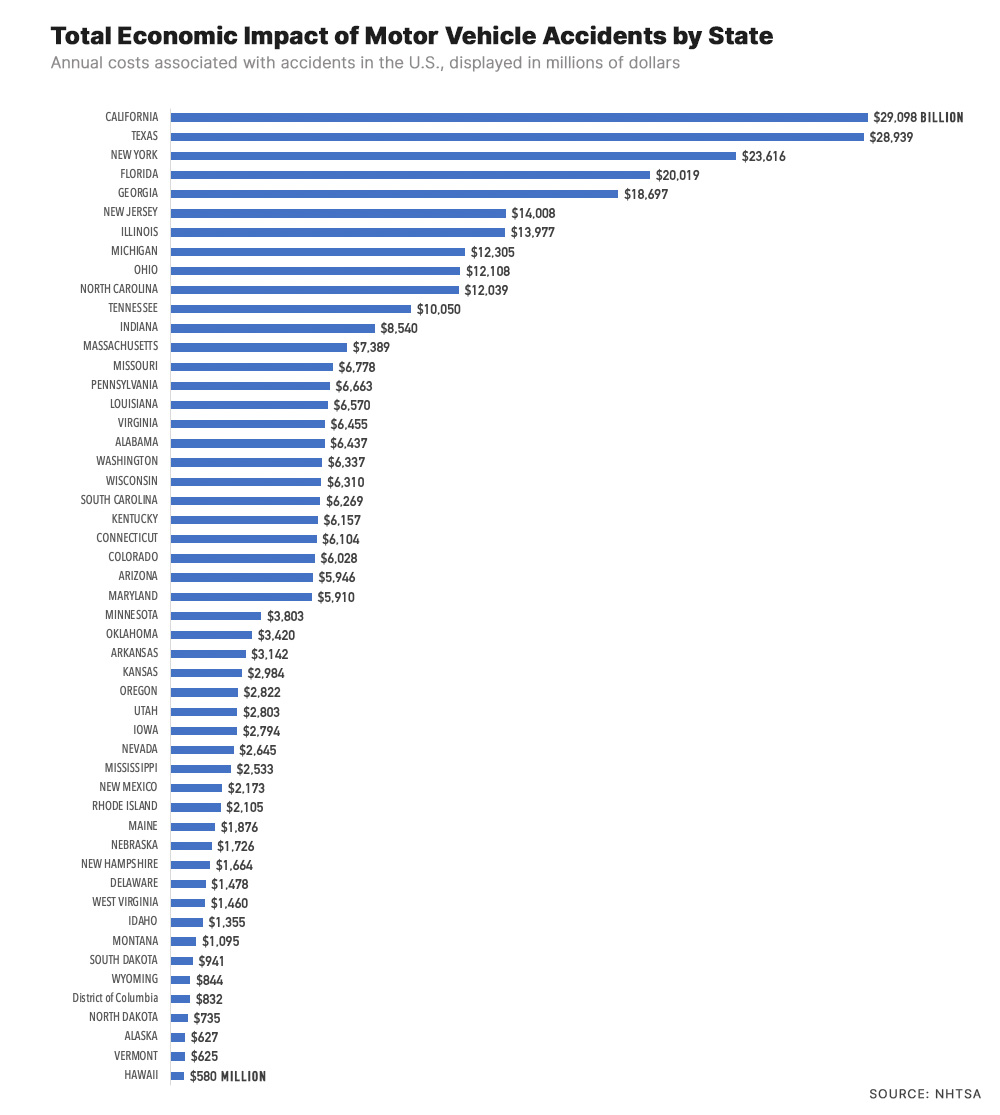
According to the National Highway Safety Administration, the total economic costs due to motor vehicle crashes was $340 billion dollars. Below is a table with the cost (in millions) of motor vehicle accidents in every state in the U.S., and D.C.
| State | Annual Cost | % Total |
| ALABAMA | $6.437 billion | 1.90% |
| ALASKA | $627 million | 0.20% |
| ARIZONA | $5.946 billion | 1.70% |
| ARKANSAS | $3.142 billion | 0.90% |
| CALIFORNIA | $29.098 billion | 8.60% |
| COLORADO | $6.028 billion | 1.80% |
| CONNECTICUT | $6.104 billion | 1.80% |
| DELAWARE | $1.478 billion | 0.40% |
| District of Columbia | $832 million | 0.20% |
| FLORIDA | $20.019 billion | 5.90% |
| GEORGIA | $18.697 billion | 5.50% |
| HAWAII | $580 million | 0.20% |
| IDAHO | $1.355 billion | 0.40% |
| ILLINOIS | $13.977 billion | 4.10% |
| INDIANA | $8.540 billion | 2.50% |
| IOWA | $2.794 billion | 0.80% |
| KANSAS | $2.984 billion | 0.90% |
| KENTUCKY | $6.157 billion | 1.80% |
| LOUISIANA | $6.570 billion | 1.90% |
| MAINE | $1.876 billion | 0.60% |
| MARYLAND | $5.910 billion | 1.70% |
| MASSACHUSETTS | $7.389 billion | 2.20% |
| MICHIGAN | $12.305 billion | 3.60% |
| MINNESOTA | $3.803 billion | 1.10% |
| MISSISSIPPI | $2.533 billion | 0.70% |
| MISSOURI | $6.778 billion | 2.00% |
| MONTANA | $1.095 billion | 0.30% |
| NEBRASKA | $1.726 billion | 0.50% |
| NEVADA | $2.645 billion | 0.80% |
| NEW HAMPSHIRE | $1.664 billion | 0.50% |
| NEW JERSEY | $14.008 billion | 4.10% |
| NEW MEXICO | $2.173 billion | 0.60% |
| NEW YORK | $23.616 billion | 6.90% |
| NORTH CAROLINA | $12.039 billion | 3.50% |
| NORTH DAKOTA | $735 million | 0.20% |
| OHIO | $12.108 billion | 3.60% |
| OKLAHOMA | $3.420 billion | 1.00% |
| OREGON | $2.822 billion | 0.80% |
| PENNSYLVANIA | $6.663 billion | 2.00% |
| RHODE ISLAND | $2.105 billion | 0.60% |
| SOUTH CAROLINA | $6.269 billion | 1.80% |
| SOUTH DAKOTA | $941 million | 0.30% |
| TENNESSEE | $10.050 billion | 3.00% |
| TEXAS | $28.939 billion | 8.50% |
| UTAH | $2.803 billion | 0.80% |
| VERMONT | $625 million | 0.20% |
| VIRGINIA | $6.455 billion | 1.90% |
| WASHINGTON | $6.337 billion | 1.90% |
| WEST VIRGINIA | $1.460 billion | 0.40% |
| WISCONSIN | $6.310 billion | 1.90% |
| WYOMING | $844 million | 0.20% |
The data is Some key observations and takeaways from this data:
- California, Texas, New York, and Florida had the highest costs of accidents, each accounting for more than 5% of the total cost. Together, these four states accounted for over a quarter of the total cost of accidents in the US.
- Alaska, Hawaii, Montana, North Dakota, South Dakota, and Wyoming had the lowest costs of accidents, each accounting for less than 1% of the total cost.
- The total cost of accidents in the US was $338.5 billion, as calculated by adding up the costs of accidents in all 50 states and the District of Columbia.
- The costs of accidents vary greatly from state to state, with California having the highest cost of accidents at over $29 billion and Wyoming having the lowest cost at $844 million.
- The cost of accidents does not necessarily correspond with the population size of a state, as some smaller states such as Rhode Island and Delaware have higher costs of accidents than some larger states like Ohio and North Carolina.
- The cost of accidents as a percentage of the total cost varies from state to state, with the highest percentage being in California at 8.6% and the lowest percentage being in North Dakota at 0.2%
The total economic costs of motor vehicle accidents each year in the U.S. is hundreds of billions of dollars. This includes costs related to:
- Lost Productivity: Motor vehicle accidents can cause injuries that result in lost work days or disability, which can have significant impacts on individuals’ and businesses’ productivity.
- Medical Costs: Medical treatment and rehabilitation costs associated with injuries sustained in car accidents can be substantial, especially in severe cases. These costs include emergency department visits, hospitalization, surgery, medication, and ongoing therapy.
- Legal and Court Costs: Car accidents can lead to legal disputes and litigation, which can result in significant legal fees, court costs, and settlements or judgments.
- Emergency Service Costs: EMS services respond to car accidents, and the cost of providing these services can be significant, including the cost of ambulance transport, emergency medical treatment, and other related services.
- Insurance Administration Costs: Insurance companies are responsible for processing and settling claims related to car accidents, which can result in significant administrative costs.
- Congestion Costs: Car accidents can cause traffic congestion and delays, resulting in economic costs associated with lost time, increased fuel consumption, and increased emissions.
- Property Damage: Typically this specifically is related to the damage to the vehicle (or vehicles) involved in the crash, but it can also include damage to other property that stemmed from the crash (buildings, fences, utility poles, street signs, etc.) Depending on the vehicles involved, car accident costs can be extremely expensive.
- Workplace Losses: Car accidents can impact businesses directly by causing workplace injuries, as well as indirectly by reducing employee productivity and increasing insurance costs.
